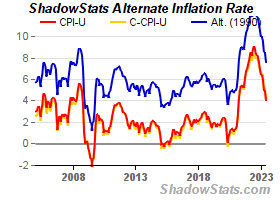
John Williams publishes government statistics based on raw government-produced data using the government’s own current and past formulas. This allows the reader to get an “apples to apples” comparison over time. True unemployment is much higher than the touted numbers by the mainstream media (MSM). True inflation is also higher. In the graphs below, SGS is “Shadow Government Statistics”, the way the government measured the rate in 1990.


You may subscribe to John’s newsletter at shadowstats.com
In a recent interview:
“Accordingly, as they did in 2008 and beyond, the Fed and Treasury can be expected to guarantee, loan, spend and create whatever money is needed to prevent a systemic failure.
The long-term cost of these actions remains inflation. Inflation, however, is likely to be a very near-term effect this time as well. The various economic and financial outlooks remain as discussed in Hyperinflation Special Report (2011); they will be reviewed in the pending Hyperinflation 2012.
Despite the September 5th historic-high gold price of $1,895.00 per troy ounce, and despite the multi-decade-high silver price of $48.70 per troy ounce, gold and silver prices have yet to re-hit their 1980 historic levels, adjusted for inflation.
The earlier all-time high of $850.00 of January 21, 1980 would be $2,472 per troy ounce, based on November 2011 CPI-U-adjusted dollars, $8,702 per troy ounce based on SGS-Alternate-CPI-adjusted dollars.
In like manner, the all-time high price for silver in January 1980 of $49.45 per troy ounce, although approached earlier this year, still has not been hit since 1980, including in terms of inflation-adjusted dollars. Based on November 2011 CPI-U inflation, the 1980 silver price peak would be $144 per troy ounce and would be $506 per troy ounce in terms of SGS-Alternate-CPI-adjusted dollars.”
I’m maintaining my “insurance policy” in unleveraged hard assets. You should ask Our Heavenly Father how you should prepare for 2012.