Update on Gold:
SPOT MARKET
Dec 11, 2008 17:13 NY Time
Bid/Ask
819.70 – 820.50
Low/High
804.00 – 835.90
1 year change
+8.10 +1.00% Increase
Gold is up 1% versus this day last year.
Update on Stock Market:
Dow Jones Industrial Average 12/11/07: 13,432.77
12/11/08: 8,565.09 1 year change: -36% Decline
Update on U.S Government Commitment to stave off a Great Depression:
Commercial paper – the Fed has committed to 1.8 trillion dollars. (Commercial paper are short term notes issued by companies which use the proceeds to pay their bills from payroll to inventory.) ($271 billion exercised)
The Term Auction Facility- (Banks borrow from the Fed) commitment $900 billion (415 billion has been issued)
Finance company debt purchases- $600 billion (buy debt issued by government-chartered housing companies such as Fannie and Freddie)
Money market facilities- up to $540 billion.
The Citigroup bail out, $301 billion, ($291 billion issued)
Term security lending for collateral- $250 billion
Term asset-backed loan facilities on credit cards and business loans- $200 billion
Loans to AIG- $123 billion
Discount window borrowing- $92 billion
Commercial program number 2- $62 billion(lends to banks so they can buy commercial paper from mutual funds)
Discount window number 2- $50 billion
Bear Stearns bailout- $29 billion
Overnight loans- $10 billion
Secondary credit- $118 billion
FDIC commitment loan guarantees- $1.4 trillion
Guarantees on GE Capital- $139 billion
Troubled Asset Relief Program or TARP passed by Congress- $700 billion
Stimulus package earlier in the year- $168 billion
Treasury exchange stabilization fund- $50 billion
Tax breaks for banks- $29 billion
"Hope for Homeowners" (the July bill)- $300 billion
Total: $8 ½ trillion dollars
Total does not include next year’s stimulus program, which preliminary talks mentioned in the Journal or press conferences can range anywhere from $500 billion to $2,000 billion.
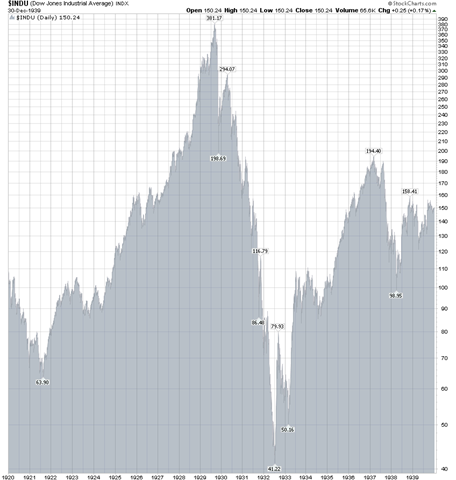
Below is a stock chart of the Great Depression. The chart begins in 1920 and ends in 1939. The Dow peaked at 381.17 in 1929 and dropped to 41.22 in 1932, an 89% decline. It wasn’t until 1954 that the market recovered to its previous high. This is what Washington is afraid of- a destruction of wealth and the nation.
Hyper-inflation is on the horizon and hard assets will be the store of value. In order to recover, the U.S. Dollar needs to decline in value.